Weather and isolated Texas system created a disaster
Editor’s note: The massive Texas power outages that took place in February 2021 left many people feeling insecure about reliable utility service. This is the second in a series of five articles about the rapidly increasing number of backup power systems being installed in Austin area residences.

Terry Poulos is a retired military and business man living with his wife Cheryl Poulos in the mini-city of Sunset Valley on the edge of south Austin. Their generator was delivered in early July, but installation was delayed because of a backlog in Sunset Valley’s permitting process.
Both have chronic health conditions: Terry has MS (multiple sclerosis), and Cheryl is diabetic. Despite the estimated $16,000 in expenses, having chilled insulin as well as heating and air conditioning are vital health imperatives. So avoiding the survivalist drama of another extended outage like one caused by Winter Storm Uri is a priority. The February outage left them without electricity and water for almost a week.
Since they could not operate their central gas heating system without electricity, they were at the mercy of a fireplace. Cheryl had to wheel their beds in front of it to stay warm (59 degrees, which was better than the bedroom at 47 degrees). She had to carry in firewood from her acre-sized lot. She had to move perishable food outside to keep it cold. She said, “The entire thing was exhausting. All that worry and anxiety.”
“I just want the reassurance (of a stand-by generator) so I can sleep at night if the power goes out,” she added. “This removes ourselves from unreliability.”
Terry, a free-market Republican, said that of the 54 families in the neighborhood, 15 have already said they will be seeking refuge in his house in the next outage. Several plan to buy their own generators.
Terry extolled the virtues of the machines. “It’s like an insurance policy. You hope you never have to use it, but if you need it you are glad you have it.”
He and his wife are strongly motivated by self-reliance. They already have 48 solar panels and collect rainwater.
After he ordered a generator, he bought stock in the company because he saw a growing trend. He urged others to, “Hurry up and get on the wait list (to buy a generator) before the wait gets longer.”
Winter storm’s death and destruction
In late May 2021, BuzzFeed News estimated that between 426 and 978 Texans died from the winter storm in the week ending February 20.
On September 1st, the Texas Department of Insurance released a report estimating at least $8.2 billion in insured losses (so far) resulted from the storm. This does not account for uninsured and unreported losses, nor does it include insurance premium increases that will probably result from the disaster. This pales in comparison to the largest all-inclusive damage estimate for Texas for Winter Storm Uri by the Perryman Group: $195 billion to $295 billion due to property damage, lost income from business closures, and crop losses.
At its worst moment, about 4.5 million of the Electric Reliability Council of Texas (ERCOT’s) 11.5 million customers were without electricity. However, this does not reflect the full impact because outages often rotated in the form of rolling brownouts. According to a survey of ERCOT customers conducted by the Hobby School of Public Affairs at the University of Houston in March 2021, 69 percent of residential ERCOT customers lost power at some point during the crisis.
Three major factors broke the ERCOT grid in February 2021: the weather (of course); the historical growth in all-electric heating; and inoperable power plants and gas wells. This story will provide a relatively concise but detailed explanation of what transpired to cause the massive grid collapse.
The weather
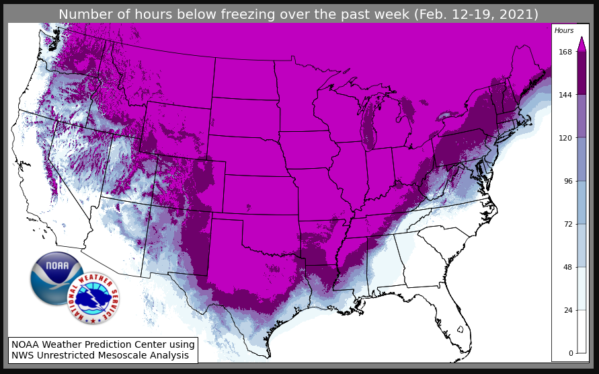
Many Texas cities, as well as weather stations throughout the Central United States, experienced new winter weather records due to Winter Storm Uri. Areas of South Texas experienced colder temperatures than some parts of Alaska during this time period.
According to the National Weather Service, many cities set new records for the number of hours at or below freezing: Austin Bergstrom (164 hours) and Austin Camp Mabry (144 hours); Houston (83 hours); Waco (205 hours); Killeen (205 hours); Abilene (252 hours); and Bryan (205 hours).
 Between February 10th and 19th, there were 806 daily records or ties of records for the lowest minimum daily temperatures at 192 Texas weather stations. Many cities or weather stations broke records on more than one of these 10 days. The Austin Bergstrom station broke records on four of these 10 days, and Austin’s Camp Mabry broke records on six of these days.
In the same period, there were 250 daily records or ties of records for snowfall recorded at 136 Texas weather stations. Del Rio, on the southern Texas border, established an all-time snowfall record of 11.18 inches in one day.
All-electric heat
This is the least recognized reason for the power outage. But at the same time, it was profoundly influential. Texas homes are now predominantly heated with electricity, which places enormous demand on the ERCOT system in extreme winter temperatures.
According to statistics from the U.S. Energy Information Administration and the Census Bureau, an estimated six million homes, or 61 percent of ERCOT customers, used electricity as their primary winter heating fuel in 2019. Almost all of these homes have electric water heating, cooking, and clothes drying as well. About 89 percent of homes that use electric heat do not have a wood-fireplace for use in emergencies.
This was not always the case. In 1970, only 8 percent of Texas homes used electricity for primary heating. Ninety percent of homes were heated with natural gas or propane.
There are options for energy-efficient all-electric homes: heat pump space heating, heat pump water heating, and induction cooking. But very few homes have hot water heat pumps and induction cooking. And few heat pump space heaters and heat pump water heaters work well at low temperatures like those that occurred during the February Texas freeze. Instead, almost all of these units revert to extremely inefficient “strip” (bare-wire) back-up heating elements, which sends ERCOT peak demand gyrating.
The growth of electric heat in Texas and the southern United States occurred for several reasons. Builders, particularly apartment builders, perceive it as less expensive to install. Another reason is that many suburban and exurban homes were, at least initially, built too far away from existing gas utility infrastructure to connect.
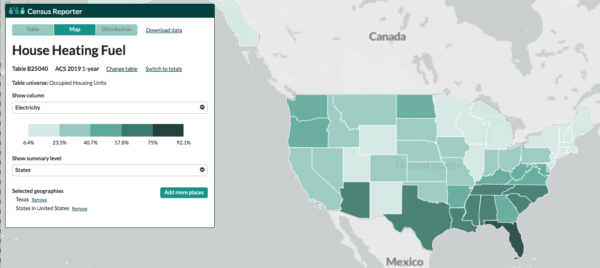 Still another factor is that Texas winters are much less intense than in northeastern and midwestern States. So all-electric heating bills are much less than in climates farther north. This explains the contrast between Texas’ 61 percent share of homes with electric heat, and New York’s 12 percent and Maine’s 8 percent.
The utility system
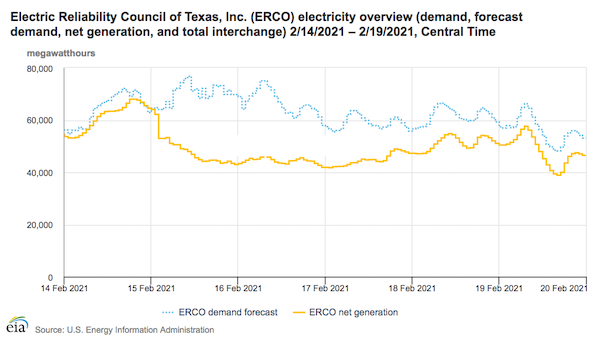
In the early morning of February 15th at 1:23am, severe cold weather that spiked winter demand forecasts to hit record highs also affected enough power plants to cause large generation curtailments. Even some plants that were reinforced for winter weather went offline. The worst part of the outage lasted through the end of February 17th, though generation shortages did not end until February 19 th at 10:36am. It took even longer to restore power to all customers.
During the worst hour of the three-day outage (11am Monday, February 15), the forecasted demand was 76,783 megawatts (MW). Had there been enough available capacity, it was so frigid that this would have bested the system’s all-time peak demand record of 74,820 MW set in the summer of 2019. But there was only enough supply for 48,747 MW, a 37 percent shortfall. Later, at 8pm the same day, more capacity losses caused a 39 percent shortfall.
How the grid broke can be explained several ways. This story will examine five causes of the electric utility crash , as follows:
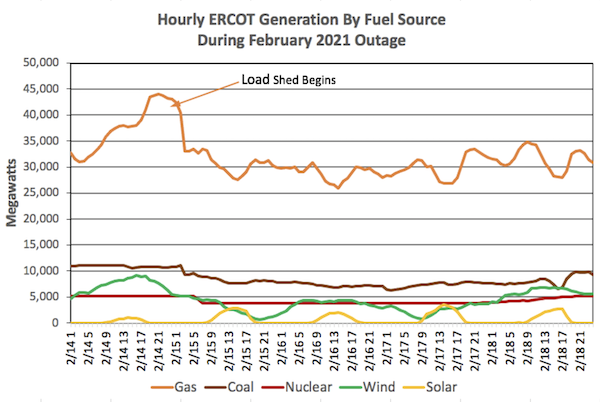
(1) Outages by fuel type—Renewable energy critics were quick to blame clean energy as the major culprit. Indeed, intermittent wind and solar did not always produce when ERCOT required power during the crisis. That said, renewable energy sources are rarely expected to produce power at peak capacity because of intermittent weather. Still, ERCOT’s wind and solar units operated at approximately 49 percent of their total forecasted expectation (5,793 MW out of 11,800 MW) at ERCOT’s worst hour during the outages.
 However, at ERCOT’s worst hour, the underperformance of conventional power plant fleet was dangerously apparent.
Gas-fired plants: ERCOT’s gas units operated at 54 percent of total rated capacity (29,857 MW out of 55,663 MW). Later during the outage, gas units reached a low point of 47 percent of their total rated capacity.
Coal-fired plants: ERCOT’s coal units operated at 57 percent of their total rated capacity (8,311 MW out of 14,480 MW). Later during the outage, coal units fell to a low of 43 percent of total rated capacity.
Nuclear plants: ERCOT lost one of its four nuclear units, so the atomic fleet operated at 73 percent of total rated capacity (3,780 MW out of 5,153 MW).
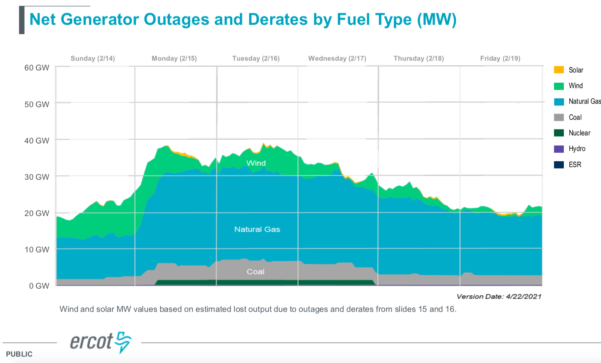
 (2) Outages by failure category—There were 585 separate generation units affected at some point during the Texas outage. ERCOT partially analyzed the reasons for these failures in an April 27, 2021 presentation available to the general public. While its analysis is not wholly transparent (ERCOT will not release source numbers for its visual charts) some estimates can be derived.
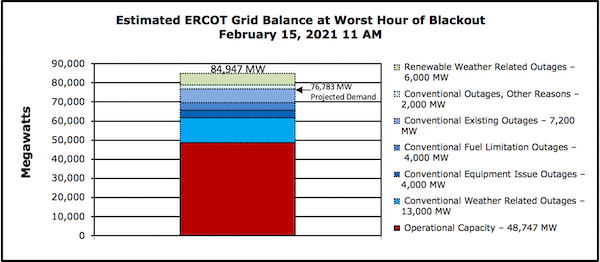 Weather-related outages and reduced power ratings of dispatchable gas, coal, and nuclear capacity—most of which could have resulted from lack of weatherization—reached about 13,000 MW at 11am February 15th, the worst hour of the outage. These outages had fallen to about 7,000 MW by the end of February 17th.
Equipment issues were responsible for about 4,000 MW of outages and capacity reductions at 11am February 15th (the worst hour), and fluctuated between 3,000 and 6,000 MW through the end of February 17th.
Fuel limitations, most of which could have resulted from lack of winter preparedness by gas producers, were responsible for the loss of about 4,000 MW at 11am February 15th and fluctuated to as high as 8,000 MW through the end of February 17th.
The Texas Oil and Gas Association has defended its members’ role in the outage, stating that a survey of its producers indicated that almost two-thirds of them were plagued by electricity cutoffs during the freeze. The implication is that the wells would have otherwise been productive. However, a July 2021 report by the Energy Institute at the University of Texas at Austin analyzed the blackout. The report stated that gas production in the Permian Basin in West Texas declined by about half between February 8th, a day with moderate weather, and February 14th, the much colder day just before the ERCOT power outage. It seems unlikely that much of this decline was due to electricity shortages.
The other major reason for conventional power capacity losses during the blackout was planned outages for maintenance and unexpected events. This was about 7,200 MW at 11am February 15, with about 6,000 MW of this being gas plants. It was not possible to quickly restart most of these plants and weather forecasts did not give much advanced notice of the storm’s severity.
If there had been more notice, restarting some of these plants for this critical period might have occurred. However, it is unknown how much of this existing outage capacity would have been affected by weather-related outages and reduced power ratings, equipment issues, or fuel limitations, had they been operational.
Various other causes resulted in outages and reduced power ratings for dispatchable power plants of an estimated 2,000 MW lost at 11am February 15th.
Regarding weather related outages and reduced power ratings for renewable energy, considerable wind capacity was kept offline because units were not winterized to prevent turbine blade icing. Solar output was minimally affected by inclement weather and equipment problems. But as stated earlier, unlike conventional power plants, failure in renewable energy production is not based on peak rating of capacity. We do not expect a 100-MW solar plant to work at midnight.
At the worst hour, about 6,000 MW of expected renewable capacity was lost. If Texas renewable energy plants been operating optimally, they would have lessened the blackout‘s severity. However, the failures were largely in conventional power plants.
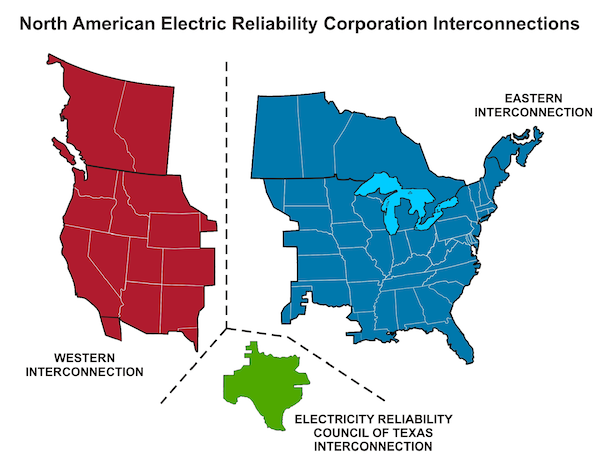
(3) Outages by lack of emergency backup power—ERCOT is an “island grid.” It can import just a tiny amount of energy from areas outside its system, about 1,220 MW. By design this constraint is self-imposed so that most of Texas avoids federal electricity regulation. But then ERCOT lacks emergency backup power in extreme weather events. There were, theoretically, more than 90,000 MW of unused dispatchable capacity, plus considerable production of intermittent wind and solar power, in the western United States that Texas could have drawn on, but literally no transmission lines to convey it. (This will be discussed in more detail in Part 4 of this series.)
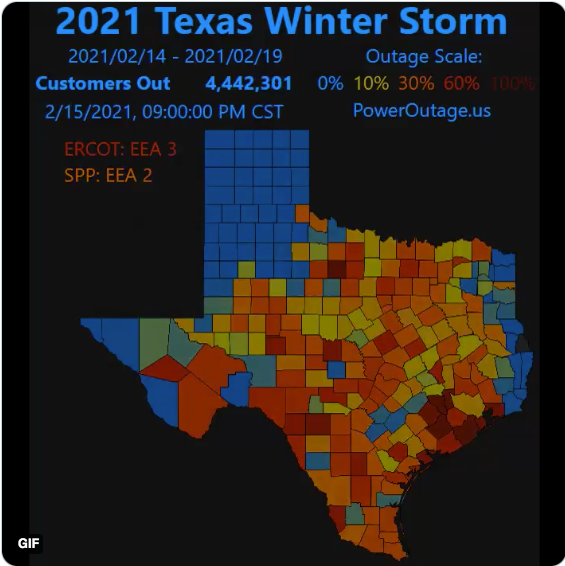
 (4) Outages compared to other states—Even though extreme winter temperatures blasted all or part of 22 states during this time period, no other state in the country came anywhere close to the Texas outage rate, either in terms of total number or percentage of customers. Below is a screenshot taken from the Web site of Poweroutage.us, a company that monitors power failures around the country in almost real time. This screenshot depicts outages on February 17th, the third day of the massive power outage.
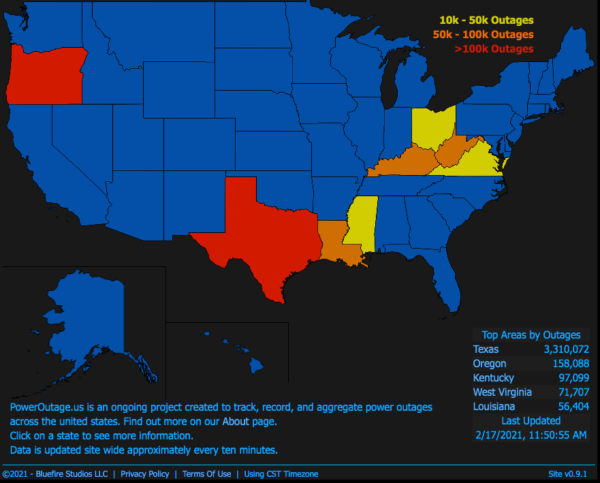
At the time, 3.3 million customers in Texas (almost all of them in ERCOT) were without power, down from its peak of about 4.5 million outages earlier in the crisis. Notice that, as shown in the chart above, every state on the Canadian border, and Alaska, experienced almost no disconnections.
The next highest state was Oregon. At its peak, 330,000 customers, about 18 percent of the total, were in the dark in the same relative time period as Texas. Oregon’s grid was ravaged when thousands of power lines were brought down by an ice storm, causing the largest power outage in its history. Texas’ problems, on the other hand, were largely caused by incompetent power plant and fuel supply management.
(5) A pricing system that incentivizes negligence—The previous discussion about power plants in northern states highlights that it is routine to operate them in frigid weather. In fact, many Texas plants did operate during the February blackout. However, many did not because there was no strict legal requirement to weatherize them for cold weather. Although the 2021 regular session of the Texas Legislature codified such a requirement, there was no firm date for implementation when this story was published.
A spokesman for the Public Utility Commission of Texas said in a September 20th email that it’s not possible to predict when commissioners may finalize the weatherization rules. “However, if they agree with the forthcoming staff recommendation, it could happen as early as October 14th. The last scheduled open meeting at which it could be considered is November 17th so I would expect some action at an open meeting or work session in that timeframe.”
Historically, power plant operators have been allowed to bid into the ERCOT market with no required standard for winter operation. Some plant owners skimped on winter weatherization costs to underbid their competitors who made such investments.
This race to the bottom not only adversely affected minimum quality of service during extreme winter events. It also discouraged investment in reliability.
Prior to passage of legislation to deregulate Texas’ electric market in 2002, it was standard for utilities to create a reserve margin of power plant capacity. These included power plants that were brought online when other plants were down for maintenance or encountered unexpected mechanical failures. And they included peak power plants that were cranked up in the very hottest and coldest hours of the year.
Since reserve power and peak power plants that do not operate frequently were no longer allowed as part of overhead in the deregulated market, an artificial and extreme price cap of $9 per kilowatt hour (kWh) was eventually established. Regulators thought the expectation of reaping windfall profits for plants that rarely operate would incentivize the private sector to build more reserve and peak-demand capacity. By comparison, energy costs in the last few years typically ran 2 to 3 cents per kWh.
But no decoupling of this $9 per kWh market cap occurs during emergencies. Excessive electric and gas costs during the February ERCOT outage have been estimated as high as $50 billion.
A free-marketeer might wonder why the tantalizing $9 per kWh market cap did not incentivize power plant weatherization. After all, owners of a weatherized power plant operating during extreme winter temperatures like those occurring in the February storm could have made a killing. It is because such weather is extremely rare. Why spend extra money on an unexpected event when you have to compete day-to-day at tight margins?
Given that Texas has not ensured reliable price mechanisms to maintain a dependable power system, consumers who can afford to are now purchasing backup generators.
This is the second in a five-part series on how and why Austinites are buying backup power systems. I hope you will be interested in Part 3: Environmental implications of residential generators.
 Trust indicators: Paul Robbins is an environmental activist and consumer advocate who has lived in Austin for almost five decades. He is editor of the Austin Environmental Directory, a sourcebook of environmental issues, products, services, and organizations in Central Texas. The publication has been offered free to the public since 1995, and can be accessed free online.